Microsoft Excel is a powerful spreadsheet software used by millions of people around the world for various purposes, such as data analysis, budgeting, and project management. The data in an Excel sheet is organized in rows and columns, which are two fundamental components of the software. In this comprehensive guide, we’ll discuss what a row and column are, the key differences between them, and a comparison chart. We’ll also delve into the various functionalities and features of rows and columns in Microsoft Excel, such as formatting, sorting, filtering, and more.
What is a Row in Excel?
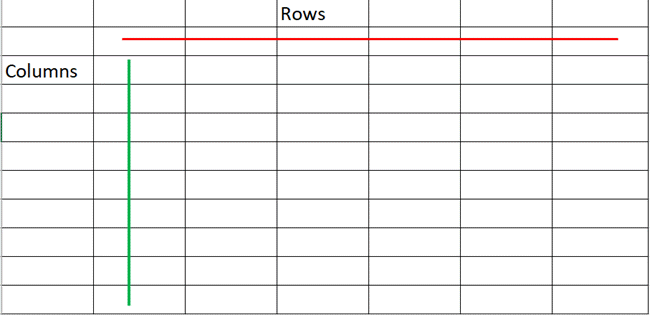
A row in Microsoft Excel is a horizontal arrangement of cells in a worksheet. Each row is identified by a number, starting from the first row with number 1 and increasing as you move down the sheet. A row can contain data, formulas, or both.
For example, consider a worksheet that contains information about sales made by a company. Each row in the sheet represents a particular sale, with columns for the date of the sale, the product sold, and the amount of the sale.
Rows are an essential component of a worksheet as they provide the structure for organizing data in the sheet. The number of rows in a worksheet can be adjusted to fit the amount of data you have, with a maximum of 1,048,576 rows in Microsoft Excel. When working with large amounts of data, it’s common to freeze the top row of a worksheet to keep the header information visible as you scroll down through the data.
What is a Column in Excel?
A column in Microsoft Excel is a vertical arrangement of cells in a worksheet. Each column is identified by a letter, starting from the first column with letter “A” and increasing as you move to the right. A column can contain data, formulas, or both.
For example, consider the same worksheet as above, with columns for the date of the sale, the product sold, and the amount of the sale. The date column contains the date of each sale, the product column contains the name of each product sold, and the amount column contains the amount of each sale.
Columns are also an essential component of a worksheet as they provide the categories or attributes of the data in the sheet. The number of columns in a worksheet can also be adjusted to fit the amount of data you have, with a maximum of 16,384 columns in Microsoft Excel.
Key differences between Rows and Columns in Excel
The key differences between rows and columns in Microsoft Excel are:
- Orientation: Rows are horizontal, while columns are vertical.
- Identification: Rows are identified by numbers, while columns are identified by letters.
- Usage: Rows can be used to represent individual records of information, while columns can be used to represent categories or attributes of the data in the sheet.
These key differences are important to understand as they determine how data is organized and structured in a worksheet. When working with large amounts of data, it’s crucial to have a clear understanding of the orientation and identification of rows and columns to efficiently navigate and manage the data.
Comparison Chart
| Feature | Row | Column |
| Orientation | Horizontal | Vertical |
| Identification | Identified by number | Identified by letter |
| Usage | Represent individual records of information | Represent categories or attributes of data |
Formatting Rows and Columns in Excel
One of the powerful features of Microsoft Excel is the ability to format rows and columns to improve the appearance and readability of a worksheet. Some of the formatting options available for rows and columns include:
- Resizing: You can adjust the height of rows and the width of columns to fit the content in the cells.
- Background color: You can change the background color of cells in rows and columns to highlight important information or distinguish between different categories of data.
- Font size and color: You can adjust the font size and color of text in cells to improve readability and make it easier to distinguish between different types of data.
- Borders: You can add borders around cells to separate them and improve the overall structure of the worksheet.
By utilizing the formatting options in Microsoft Excel, you can make your worksheet look professional and easy to read.
Sorting and Filtering Data in Excel
Another useful feature of Microsoft Excel is the ability to sort and filter data based on the values in rows and columns. Sorting allows you to rearrange data in a worksheet based on a specific column, either in ascending or descending order. Filtering allows you to hide rows that don’t meet specific criteria, making it easier to focus on the data you need.
For example, if you have a worksheet that contains sales data for a company, you can sort the data by the date column to see sales made in a specific date range, or filter the data by the product column to see sales made for a specific product.
Conclusion
In conclusion, rows and columns are the fundamental components of Microsoft Excel, providing the structure and organization for data in a worksheet. By understanding the orientation, identification, and usage of rows and columns, as well as utilizing features such as formatting, sorting, and filtering, you can efficiently manage and analyze data in Microsoft Excel. Whether you’re using Excel for personal or professional purposes, understanding the role of rows and columns is essential to getting the most out of this powerful software.